The 3 Minute All-Out CV Test from In-Game Tracking Data
Introduction
Critical velocity typically requires athletes perform three-to-five-time trials at various distances. A parabolic function is then fit to the data, returning parameters that are meant to represent their max speed, critical velocity, and anaerobic capacity (D’).
The three-minute test is a validated method of assessing an athlete’s critical velocity and D’. The concept was that if an athlete were to run as far as possible in three minutes, their D’ would be depleted after approximately 150 s and their mean velocity between 150 s and 180 s is their critical velocity. Researchers working with field-sport athletes adapted the test so that participants performed shuttle runs. The change-of-direction was meant to represent the need to stop-and-start as they would during a competitive match.
With the recent push to assess an athlete’s fitness using positional tracking data, I have begun experimenting with ways of emulating the three-minute critical velocity test. The approach was to utilize in-game data to extract observations that are similar-enough to the three-minute test so that critical velocity can be approximated. Additionally, if the data adequately represented the three-minute test, D’ would be calculated.
Finally, as a proof-of-concept, if critical velocity and D’ could be determined, the D’ balance model would be utilized to model and visualize the athlete’s anaerobic energy utilization per session.
Methods
A single soccer player’s data was analyzed. The athlete participated in a total of 36 games and practices wearing a positional tracking unit.
Observations were extracted similarly to those from Roecker and colleagues (2020). In the interest of time, the greatest average speed was retained for every second for each session. The max global speed for each time-point was then retained. The result was 41 data sets: 40 maximal average speed data sets, and 1 maximal average speed data set that incorporated the single greatest speed per duration.
Following some experimentation, it was found that computing resources to calculate median velocities for 21 data points (as per Roecker and colleagues (2020)) are exponentially greater than calculating mean velocities. Since this is not publishable research, it was decided that the benefit to using maximal median values was outweighed by the amount of time needed to run the analyses.
Lastly, D’ was calculated as the mean velocity from 1 to 150 s multiplied by 150 minus the distance travelled at critical speed for the same duration and critical velocity was calculated as the average velocity between 151 s and 180 s.
and
Results
Due to various constraints, some of the intermediary results cannot be shared.
The athlete competed in 36 total games and practices. Their mean speed during the interval 1 s to 150 s was
Anaerobic capacity, D’, was returned as
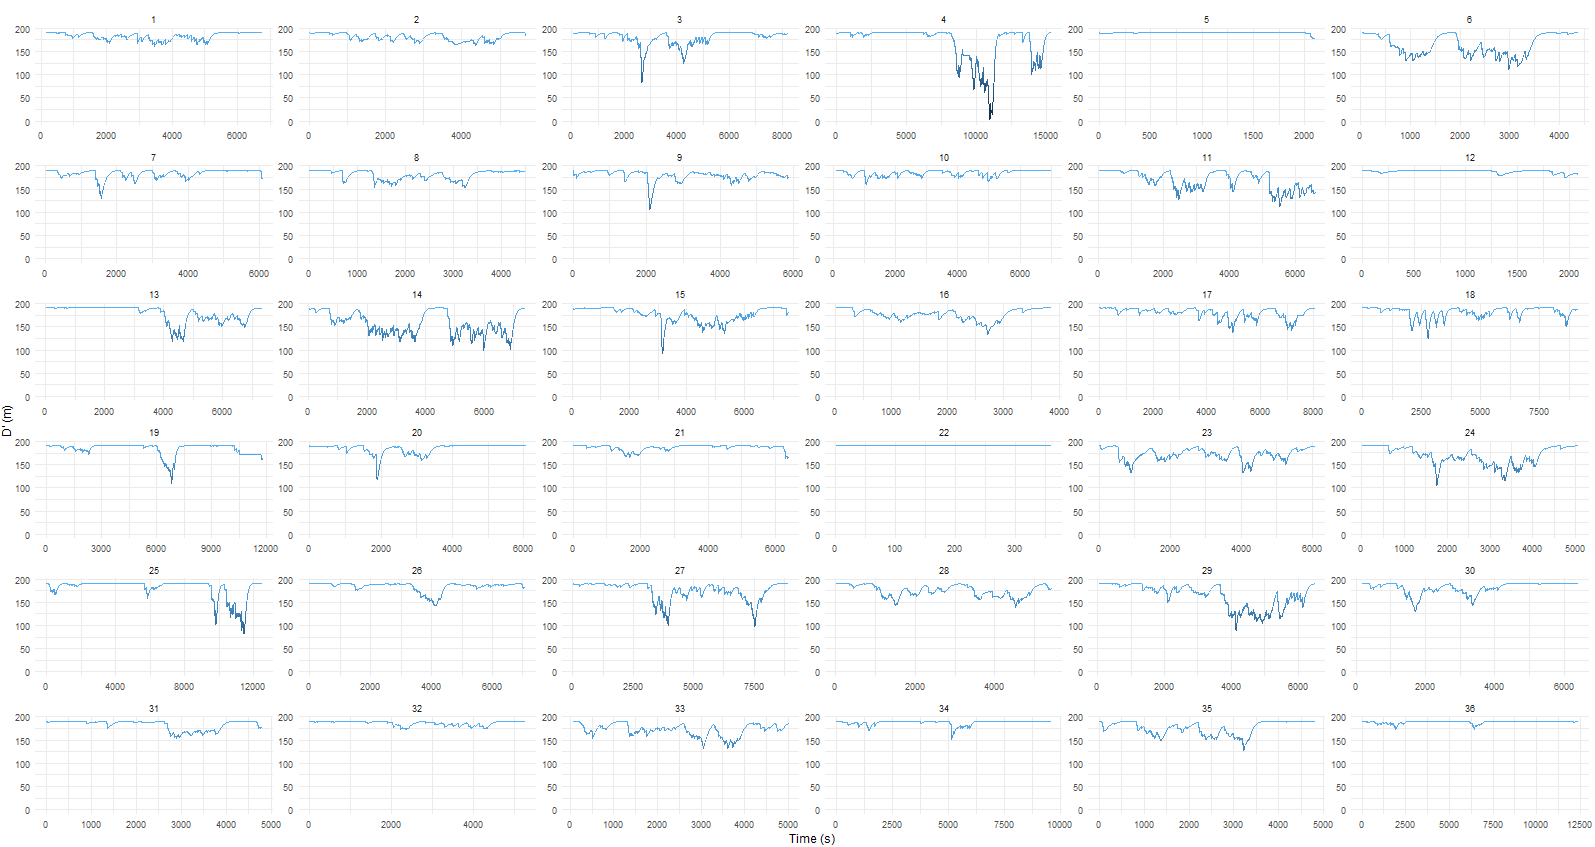
D’ Balance
Using the modelled critical velocity and D’ values, D’ balance was calculated for each session. The athlete’s anaerobic energy was never depleted, with the greatest depletion being
Discussion
This post explored whether positional tracking data could be used in a similar fashion as the three-minute all-out critical velocity test to estimate an athlete’s critical velocity and D’. If D’ estimates were reasonable, a subsequent goal was to explore the athlete’s D’ balance during multiple sessions.
The results indicate that the methods described above have potential of estimating all of the parameters. Namely, critical velocity was within 10% of lab-tested critical velocity. This is well within reason seeing that previous research that explored the relationship between linear and shuttle run critical velocity tests returned a mean discrepancy of 17% favouring the linear test. D’ was 191 m which is on the mid- to low-end of previously reported D’ values. Although, discrepancies could results from: 1. the athletes that were previously tested were rugby players, and 2. the data acquired for this athlete was during their first 5 weeks of pre-season training. Therefore, the athlete could have been deconditioned or values may be depressed because the majority of the sessions were low-intensity practices.
In conclusion, there is reason to believe that this method could be used in team-sports to estimate critical velocity and D’. These parameters can then be used to track changes in fitness throughout a competitive season. Further explorations are warranted, and future posts will look into data from other soccer players.